Building my own train departure board (because why not?)

In the UK, we’re lucky to have access to a rich supply of transport data. From bus timetables to cycle hire stats, there’s a load of open data just waiting to be used in clever ways. Some of the more interesting data – at least for geeks like me – is contained in the National Rail data feeds. These provide real-time information about trains moving around the country. Every late-running service, every platform change, every cancelled train… it’s all there, in near real-time.

There are already some excellent tools built on top of this data. You may have come across some of these sites:

  • RealTimeTrains: essential for anyone who wants to go beyond the standard passenger information displayed at the station.
  • Live Departures Info: perfect for an always-on browser display – e.g. on digital signage.
  • LED Departure Board: provides a view of upcoming departures or arrivals at a chosen station.

There are even physical displays, like those from UK Departure Boards. These look to be beautifully made and ideal for an office or hallway wall. But they’re not cheap. And that got me thinking…

Why not build my own?

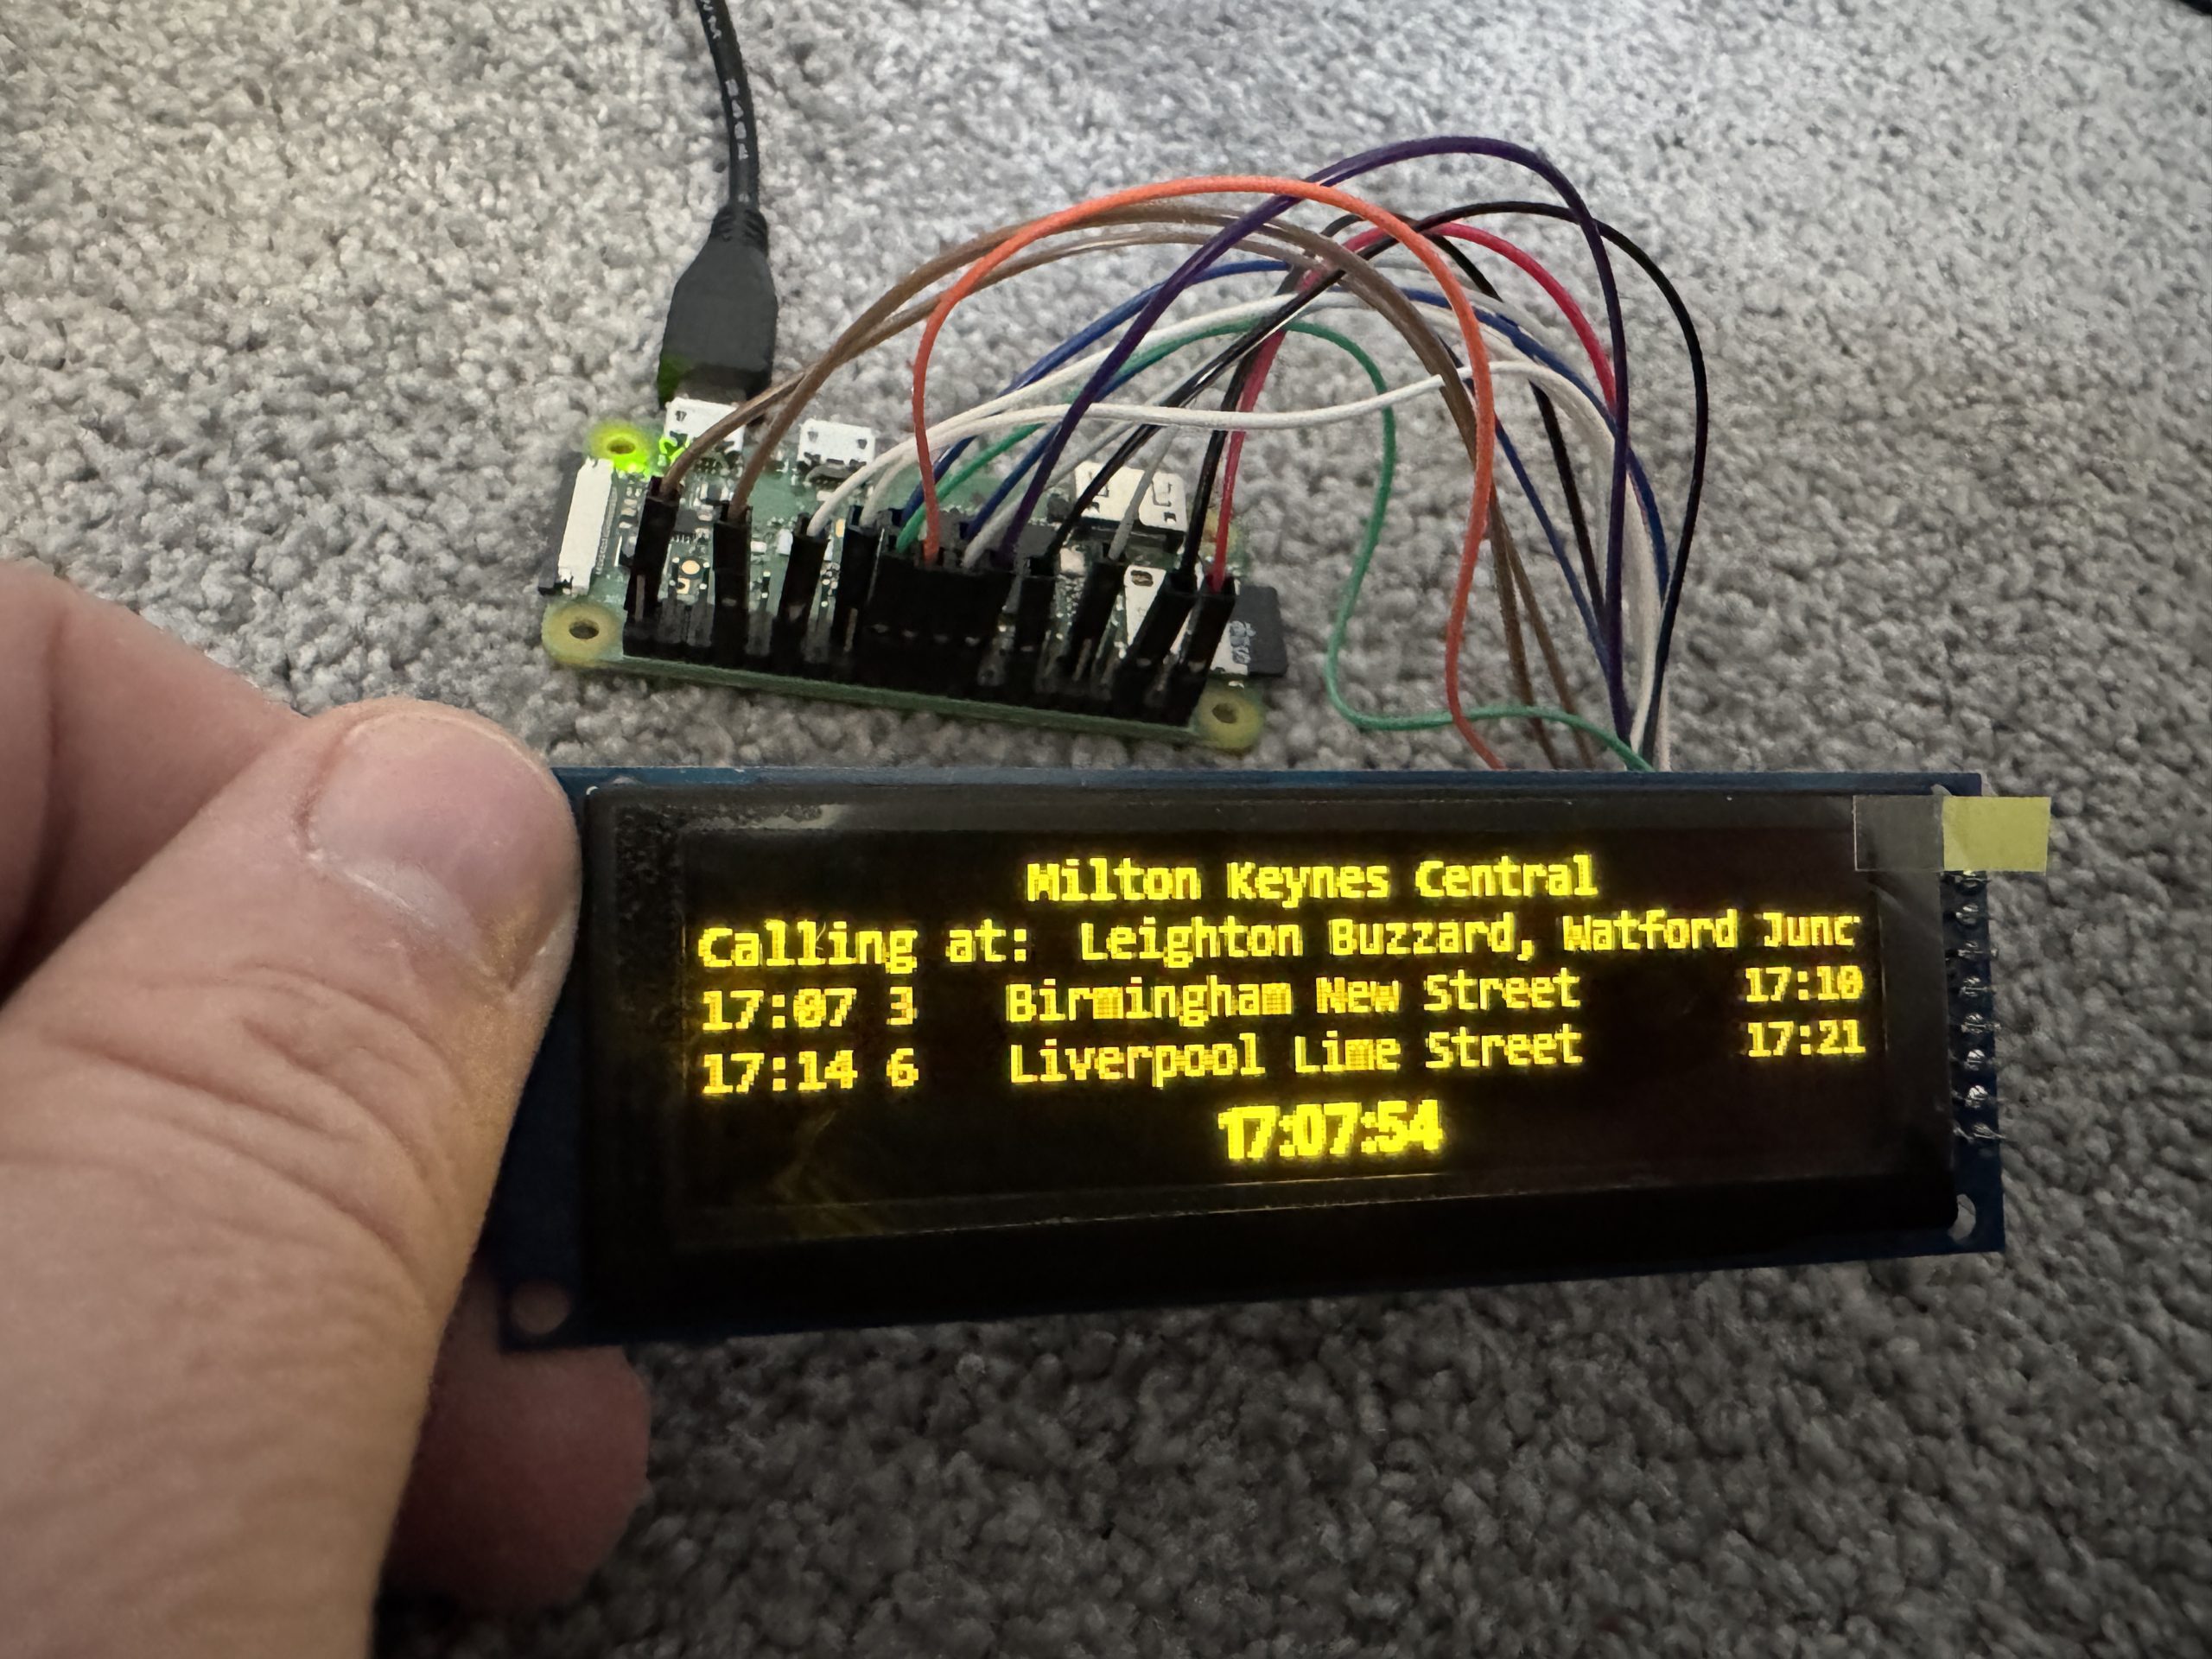
Armed with a Raspberry Pi Zero W and an inexpensive OLED display, I decided to have a go at making my own.

A quick bit of Googling turned up an excellent website by Jonathan Foot, whose DIY departure board guidance gave me exactly what I needed. It walks through how to connect everything up, pull real-time train data, and output it to a screen. There’s even a GitHub repo for the code. Perfect.

Well, almost.

A slightly different display

Jonathan recommends a particular OLED display but I thought it was a bit on the pricey side. In the spirit of experimentation (and budget-conscious tinkering), I opted for a 3.12″ OLED display (256×64, SSD1322, SPI) from AliExpress. I think it’s the same – just from another channel.

This wasn’t entirely straightforward.

The display I received was described as SPI-compatible, but it wasn’t actually configured for SPI out of the box. I sent the first one back. Then I realised they’re all like that – you have to modify the board yourself.

Breaking out the soldering iron

There were no jumpers to move. No handy DIP switch to flick. Instead, I had to convert it from 80xx to 4SPI mode. This involved removing a resistor (R6), then soldering a link between two pads (R5). Not the hardest job in the world, but definitely not plug-and-play either.

This wasn’t ideal. I’m terrible at soldering, and I’d deliberately bought versions of the Raspberry Pi and the display with pluggable headers. But hey, I’d got this far. The worst thing that could happen is that I blew up a £12 display, right?

The modifications that I made to the display. (The information I needed is printed as a table on the back of the board.)

Once that was done, though – magic! The display came to life with data from my local station, and a rolling list of upcoming arrivals and departures. It’s a surprisingly satisfying thing to see working for the first time, especially knowing what went into making it happen.

What’s next?

All that’s left now is to print a case (or find someone with a 3D printer who owes me a favour). For around £50 in total, I’ve got a configurable, real-time train departure board that wouldn’t look out of place in a study, hallway or even the living room (subject to domestic approval, of course).

It’s been a fun little side project. A mix of software tinkering, a bit of hardware hacking, and that moment of joy when it all works together. And if you’ve ever looked at those expensive display boards and thought, I bet I could make one of those – well, now you know… you probably can.

Featured image: author’s own.
5 “stars” to linked open data

This content is 13 years old. I don't routinely update old blog posts as they are only intended to represent a view at a particular point in time. Please be warned that the information here may be out of date.

Every now and again I have a peek into the world of linked and open data. It’s something that generates a lot of excitement for me in that the possibilities are enormous but, as a non-developer and someone whose career has tended to circle around infrastructure architecture rather than application or information architectures, it’s not something I get to do much work with (although I did co-author a paper earlier this year looking at linked data in the context of big data).

Earlier this year (or possibly last), I was at a British Computer Society (BCS) event that aimed to explain linked data to executives, with promises of building a business case. At that event Antonio Acuna, Head of Data at data.gov.uk presented a great overview of linked and open data*. Although I did try, I was unable to get a copy of Antonio’s slides (oh, the irony!) but one of them sprung to mind when I saw a tweet from Dierdre Lee (@deirdrelee) earlier today:

Star rating of #opendata can be improved sequentially. Describe metadata using #RDF even if content isn't yet #dcat #LinkedData #datadrive
@deirdrelee
Deirdre Lee

The star rating that Dierdre is referring to is Sir Tim Berners-Lee’s 5 star model for linked open data. Sir Tim’s post has a lot more detail but, put simply, the star ratings are as follows:

No star web data Available on the web (whatever format) without an open license
One star open web data Available on the web (whatever format) but with an open licence, to be Open Data
Two star open web data Available as machine-readable structured data (e.g. excel instead of image scan of a table)
Three star open web data As for 2 stars, but in a non-proprietary format (e.g. CSV instead of Excel)
Four star open web data All the above plus, use open standards from W3C (RDF and SPARQL) to identify things, so that “people can point at your stuff”
Five star open web data All the above, plus: link your data to other people’s data to provide context

It all sounds remarkable elegant – and is certainly a step-by-step approach that can be followed to opening up and linking data, without trying to “do everything in one go”.

*Linked and open data are not the same but they are closely related. In the context of this post we can say that open data is concerned with publishing data sets (with an open license) and linked data is concerned with creating links between data sets (open or otherwise) to form a semantic web.

Attribution: The data badges used on this post are from Ireland’s Digital Enterprise Research Institute (DERI), licensed under a Creative Commons Attribution 3.0 License.


Short takes: from the consumerisation of IT to open data

This content is 14 years old. I don't routinely update old blog posts as they are only intended to represent a view at a particular point in time. Please be warned that the information here may be out of date.

This week has been a crazy one – and things don’t look like getting much easier over the next few weeks as we enter a new financial year and my job shifts its focus to be less externally-focused and more about technical strategy and governance. This blog has always been my personal blog – rather than something for my work – but the number of posts is inversely proportional to the amount of time I have on my hands which, right now, is not very much at all.

So I’m taking a new tack… each time I attend an event, instead of trying to write up all the key points, I’ll blog about the highlights and then (hopefully) come back with some details later… well, that’s the plan at least…

This week (on top of all the corporate stuff that I can’t really write about here), I attended two really worthwhile events that were very different but equally worthy of note – for very different reasons.

IDC Consumerisation of IT 2012 briefing

Analyst briefings are normally pretty dry: pick a hotel somewhere; sit on uncomfortable chairs in a large meeting room; and listen to analysts talk about their latest findings, accompanied with some PowerPoint (which you might, or might not have access to later…). This one was much better – and kudos is due to the IDC team that arranged it.

Not only was London’s Charlotte Street Hotel a much better venue (it may have had a tiny circulation area for pre/post event networking but it has a fantastic, cinema-style screening room) but there was a good mix of content as analysts covered a variety of consumerisation-based topics from an overview (risk management or business transformation) through sessions on how mobile devices are shaping the enterprise and on the state of the PC market, on to consumerisation and the cloud before finally looking at the impact of consumerisation on the IT services market.

I did cause some controversy though: tweeting a throwaway comment from an analyst about the organisation’s continued use of Windows XP attracted attention from one of the journalists who follows me in the US (IDC suggested that I took the comment out of context – which I would dispute – although, to be fair, much of the industry suffers from “Cobblers Shoes”); and I was not at all convinced by IDC’s positioning of VDI as an appropach to consumerisation (it’s a tactical solution at best – strategically we should be thinking past the concept of a “desktop” and focusing on secure access to apps and data, not on devices and operating systems) – prompting a follow-up email from the analyst concerned.

It used to be vendors (mostly Microsoft) that I argued with – now it seems I need to work on my analyst relations!

Ordnance Survey Open Data Master Class

I recently wrote a white paper looking at the potential to use linked data to connect and exploit big data and I have to admit that I find “big” data a bit dull really (Dan Young’s tweet made me laugh).

So #bigdata is any data set that exceeds your experience in managing it (@). After you've kicked its ass, it's just boring data again?
@dan0young
Dan Young

What I find truly exciting though is the concept of a web of (linked) open data. It’s all very well writing white papers about the concepts but I wanted to roll my sleeves up and have a go for myself so, when I saw that Ordnance Survey were running a series of “master classes”, I booked myself onto a session and headed down to the OS headquarters in Southampton. That was interesting in itself as I worked on a project at Ordnance Survey to move the organisation from Microsoft Mail to Exchange Server in the late 1990s but that was at the old premises – they’ve recently moved to a brand new building (purely office space – printing is outsourced these days) and it was interesting to see how things have moved on.

After an introduction to open data, Ordnance Survey’s Ian Holt (the GeoDoctor) took us through some of the OS open data sets that are available before Chris Parker spoke about Geovation and some of the challenges they are running (working with 100%Open, who also collaborate with some of my colleagues on Fujitsu’s Open Innovation Service). We then moved on to some practical sessions that have been created by Samuel Leung at the University of Southampton, using nothing more than some open source GIS software (Quantum GIS) and Microsoft Excel (although anything that can edit .CSV files would do really) – the materials are available for anyone to download if they want to have a go.

Even though the exercises were purely desktop-based (I would have liked to mash up some open data on the web) it was a great introduction to working with open data (from finding and accessing it, through to carying out some meaningful analysis) and I learned that open data is not just for developers!

[Update 2 April 2012: I won’t be writing another post about the IDC consumerisation of IT event as they have emailed all delegates to say that it was a private session and they don’t want people to publish notes/pictures]